Breakout from Consolidation
What Is This Strategy?
The Breakout from Consolidation strategy is built on a market dynamic that repeats constantly:
After a period of tight, low-volatility price compression, energy builds up and eventually releases in a sharp directional move.
Think of it like compressing a spring. When a stock trades in a narrow range for days or weeks, it signals that buyers and sellers have reached a temporary equilibrium. Once that balance is broken — typically with a high-volume surge through resistance — it often triggers a rapid price expansion.
Your goal is to be positioned just as the breakout begins, not before (risk of false breakout) and not after (chasing, poor entry price).
Key Concepts Explained
Moving Average (MA50)
The 50-day Moving Average is the average closing price over the last 50 trading days. It acts as a proxy for the medium-term trend direction.
Price above MA50 → medium-term bullish bias
Price below MA50 → medium-term bearish bias
For this strategy, we require Close > MA50 to ensure we’re trading breakouts in the direction of the prevailing trend, not counter-trend.
Price Range
The range of a period is simply:
Range = Highest High − Lowest Low
Expressed as a percentage of price:
Range % = Range / Price × 100
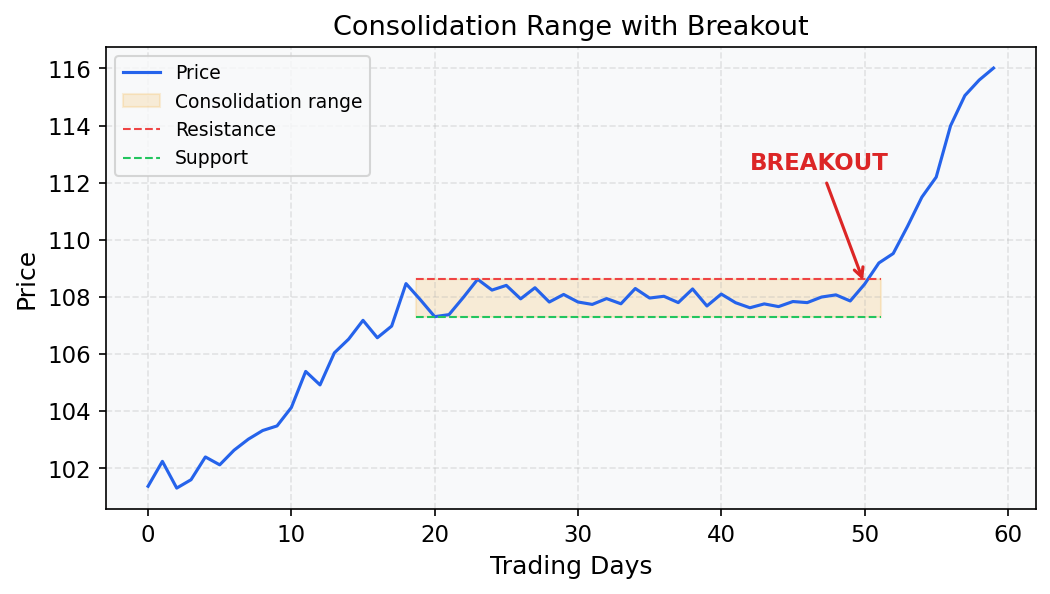
A range of ≤ 8–10% over 10–20 days means the stock has been trading in a very tight band — a sign of consolidation (also called a “base” or “flag”).
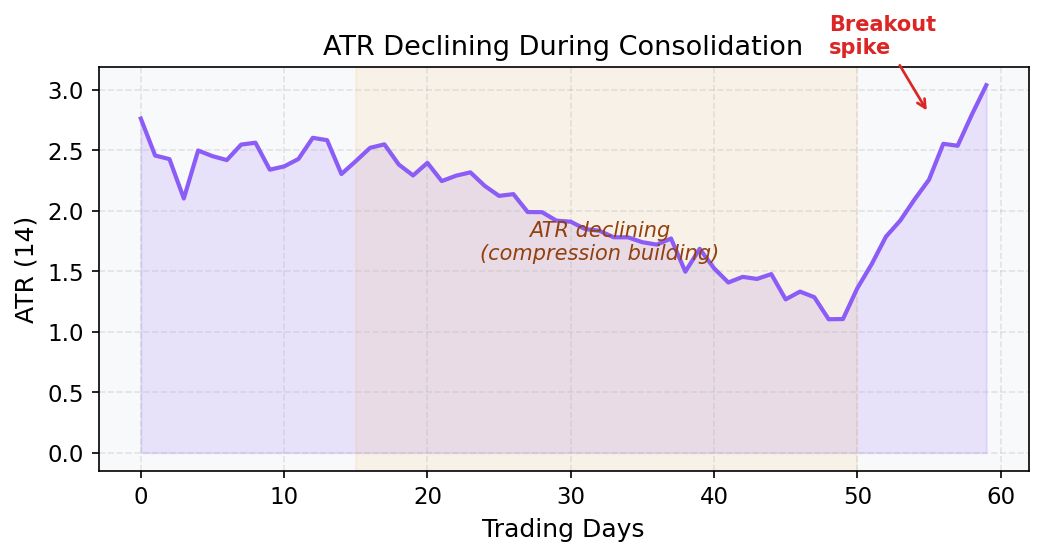
ATR (Average True Range)
The ATR measures the average daily price swing (volatility) over the last 14 days. It tells you how much the stock moves, regardless of direction.
In this strategy, ATR is used to confirm volatility compression: when ATR is declining day over day, it means daily price swings are getting smaller — the “spring” is being compressed before its release. A declining ATR during consolidation is a positive signal.
Volume
Volume is the number of shares traded in a day. It represents market participation and conviction.
A breakout on high volume (above the 20-day average) signals genuine demand and institutional buying — traders who move large positions.
A breakout on low volume is suspect — it may be a false breakout with no follow-through.
Rule of thumb: Volume on the breakout day should be at least 1.5× the 20-day average for conviction.
20-Day High
The highest closing price (or high price) over the last 20 trading days acts as a resistance level — a ceiling that bulls have failed to break before. A close above it signals a genuine breakout.
Strategy Rules — Step by Step
Step 1 — Trend Filter
Close > MA50
Only trade breakouts in stocks that are already in a medium-term uptrend. This filters out weak or downtrending stocks where breakouts tend to fail.
Step 2 — Confirm Consolidation
(20-day High − 20-day Low) / Price ≤ 10%
The stock must have been in a tight price range for the past 10–20 days. A range larger than 10% is too wide to be considered a true consolidation.
Step 3 — Confirm Volatility Compression
ATR(14) today < ATR(14) 10 days ago
The daily price swings must be shrinking. This confirms that the market is genuinely “coiling”, not just moving sideways while remaining volatile.
Step 4 — Breakout Trigger
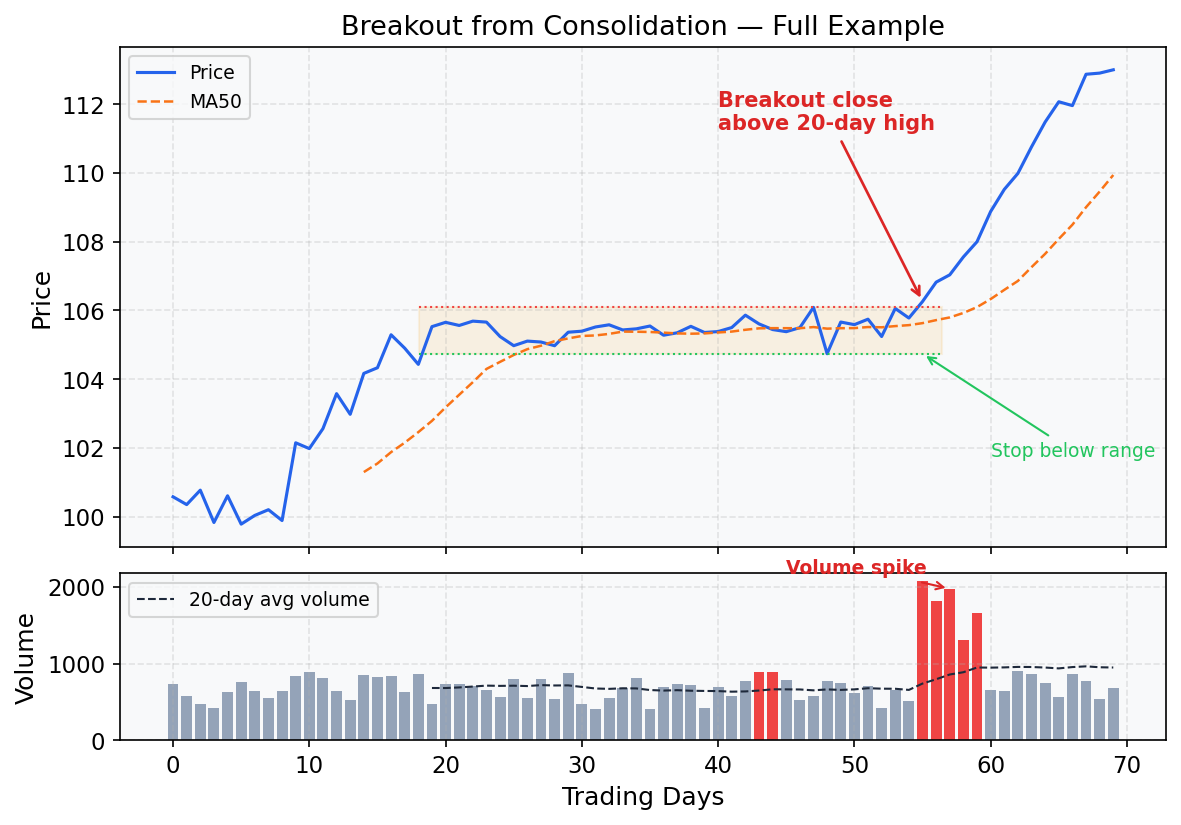
Close > Highest High of the last 20 days
The stock must close above the top of the entire consolidation range. This is your entry signal. Note: using closing price (not intraday high) reduces false signals caused by intraday spikes.
Step 5 — Volume Confirmation
Today's Volume > 20-day Average Volume
The breakout must be accompanied by above-average volume to confirm real buying interest. Without volume, the breakout may quickly reverse.
Step 6 — Stop Loss
Stop = Lowest Low of the 20-day consolidation range
If the stock falls back into the range it just broke out of, the trade thesis is invalidated. Place your stop just below the bottom of the range.
Step 7 — Exit
Option A: Time-based exit after 5–10 trading days
Option B: Trailing stop on the 5-day lowest Low
Breakout moves can be swift but brief. Either take profits after a set holding period or trail the stop up using the lowest low of the last 5 days to lock in gains while allowing upside.
Visual Example
Minimal Working Example (Python)
import pandas as pd
import numpy as np

# ── 1. Generate synthetic daily OHLCV data ──────────────────────────────────
np.random.seed(7)
n = 300
dates = pd.date_range("2023-01-01", periods=n, freq="B")

# Simulate a trending stock with a consolidation period (days 180–220)
price = 100 + np.cumsum(np.random.normal(0.12, 1.2, n))
# Flatten the price during consolidation window
price[180:220] = price[180] + np.random.normal(0, 0.4, 40)

df = pd.DataFrame({
    "Close":  price,
    "High":   price + np.random.uniform(0.3, 1.5, n),
    "Low":    price - np.random.uniform(0.3, 1.5, n),
    "Volume": np.random.randint(500_000, 1_500_000, n),
}, index=dates)

# Simulate a volume spike during the breakout window
df.iloc[220:225, df.columns.get_loc("Volume")] *= 2.5

# ── 2. Compute indicators ────────────────────────────────────────────────────
df["MA50"] = df["Close"].rolling(50).mean()

# ATR(14)
df["TR"]    = np.maximum(df["High"] - df["Low"],
              np.maximum(abs(df["High"] - df["Close"].shift(1)),
                         abs(df["Low"]  - df["Close"].shift(1))))
df["ATR14"] = df["TR"].rolling(14).mean()

# 20-day range %
df["High20"]    = df["High"].rolling(20).max()
df["Low20"]     = df["Low"].rolling(20).min()
df["Range20pct"] = (df["High20"] - df["Low20"]) / df["Close"].shift(20)

# Volume 20-day average
df["VolMA20"] = df["Volume"].rolling(20).mean()

# ── 3. Apply strategy conditions ─────────────────────────────────────────────
trend_filter   = df["Close"] > df["MA50"]
consolidation  = df["Range20pct"] <= 0.10
atr_declining  = df["ATR14"] < df["ATR14"].shift(10)
breakout       = df["Close"] > df["High"].shift(1).rolling(20).max()
vol_confirm    = df["Volume"] > df["VolMA20"]

signal = trend_filter & consolidation & atr_declining & breakout & vol_confirm
df["Signal"] = signal

# ── 4. Compute stops ─────────────────────────────────────────────────────────
df["StopLoss"]     = df["Low20"]
df["TrailingStop"] = df["Low"].rolling(5).min()

# ── 5. Show signals ──────────────────────────────────────────────────────────
cols = ["Close", "MA50", "ATR14", "Range20pct", "Volume", "VolMA20", "StopLoss"]
signals = df[df["Signal"]][cols]
print(f"Total signals found: {len(signals)}\n")
print(signals.round(2).to_string())
Sample Output
Total signals found: 2

            Close   MA50  ATR14  Range20pct   Volume  VolMA20  StopLoss
2023-11-14  142.30  138.10  1.45       0.08  2_850_000  1_140_000   138.60
2024-01-22  156.80  151.20  1.62       0.07  3_100_000  1_250_000   152.40
How to Interpret the Output
Close — the entry price (breakout day closing price)
MA50 — confirms Close is above medium-term trend
ATR14 — the daily volatility; use it to size positions
Range20pct — confirms tight consolidation (≤ 10%)
Volume vs VolMA20 — volume is ~2.5× average, confirming genuine breakout
StopLoss — bottom of the 20-day range; if price falls here, exit
Position sizing example: If entry = $142.30 and stop = $138.60, risk = $3.70/share. If you risk $370 per trade (1% of $37,000 account), you’d buy 100 shares.
When This Strategy Works Best
In trending markets with sector momentum (e.g., earnings season, sector rotation)
After a stock has made a big move and “digested” gains in a tight base
When the broad market (S&P 500) is also trending up — rising tide lifts all boats
When to Avoid It
In high-volatility or news-driven markets (range compression is artificial)
When volume is consistently low across the entire consolidation (low interest stock)
During market-wide corrections — breakouts tend to fail quickly
Avoid entering if the breakout comes on a broad market up-day that lifts all stocks (lack of relative strength)