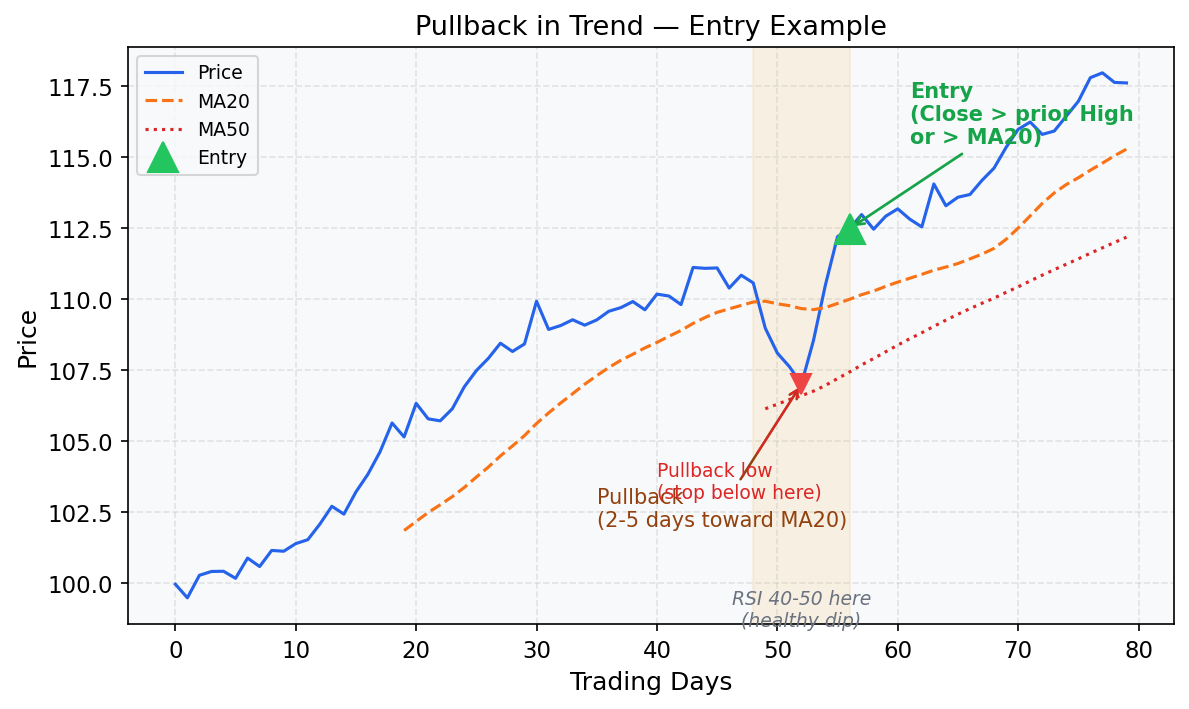
Pullback in Trend (Trend Continuation)
What Is This Strategy?
The Pullback in Trend strategy is a swing trading approach built on a simple idea:
When a stock is in a healthy uptrend, short-term dips are buying opportunities — not reasons to sell.
Instead of chasing a stock at its highs, you wait for the price to temporarily retrace (pull back), and then enter when the upward momentum resumes. This gives you a better entry price and a tighter, well-defined stop loss.
Key Concepts Explained
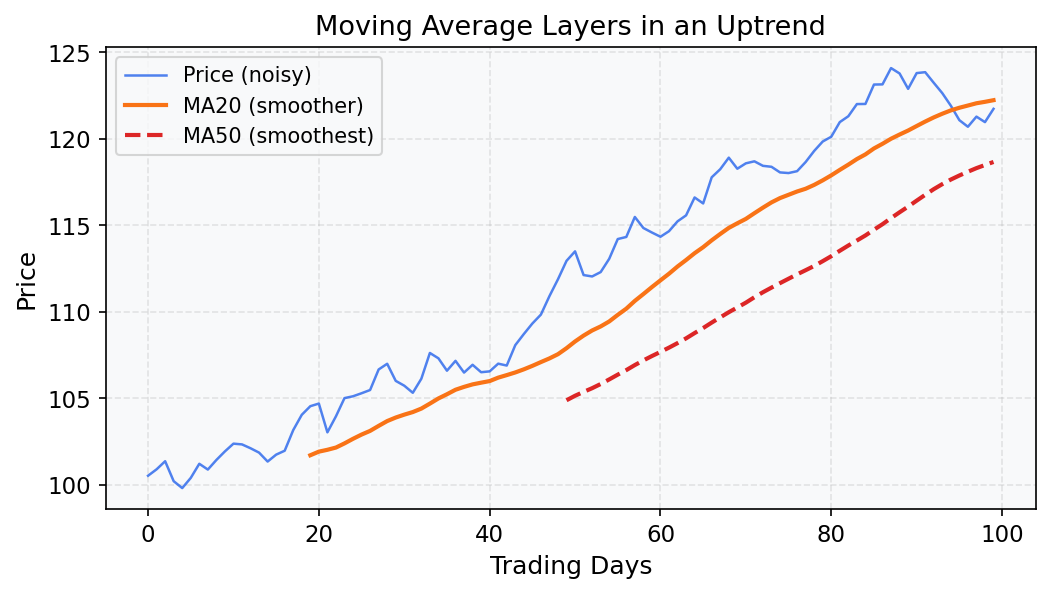
Moving Average (MA)
A Moving Average smooths out daily price noise by calculating the average closing price over the last N days. It’s a line on the chart that shows the underlying direction of the trend.
MA20 = average of the last 20 closes → short-term trend
MA50 = average of the last 50 closes → medium-term trend
MA200 = average of the last 200 closes → long-term trend
When price is above a moving average, the trend in that timeframe is considered bullish. When a shorter MA is above a longer MA (e.g., MA50 > MA200), it confirms a healthy, multi-timeframe uptrend — this is often called a Golden Cross structure.
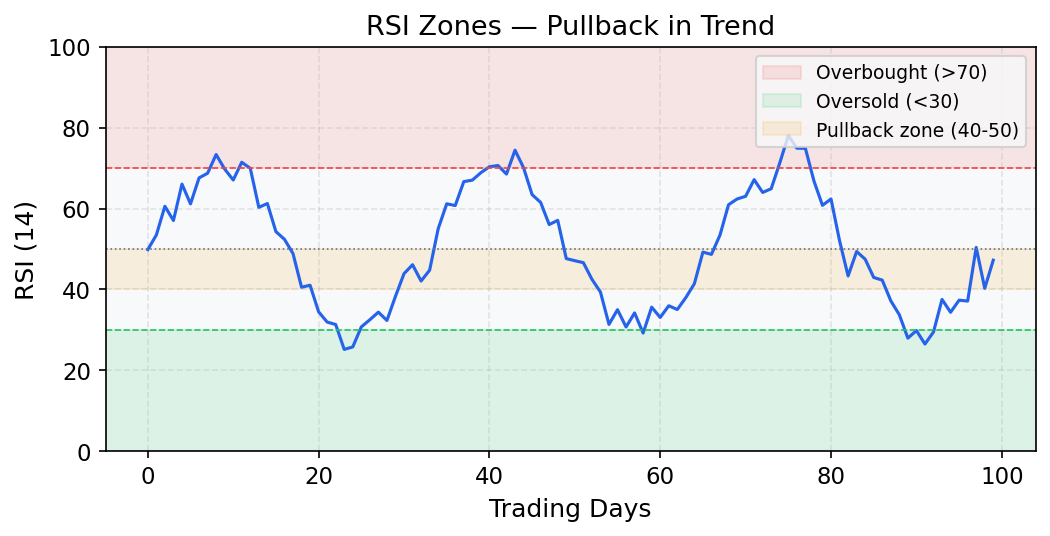
RSI (Relative Strength Index)
The RSI is a momentum oscillator ranging from 0 to 100. It measures how fast and how much a price has moved recently, indicating whether a stock is overbought or oversold.
RSI > 70 → Overbought: the stock may have risen too far, too fast
RSI < 30 → Oversold: the stock may have fallen too far, too fast
RSI 40–50 → Mild pullback within an uptrend: not too weak, just pausing
ATR (Average True Range)
The ATR measures a stock’s average daily price movement (volatility) over N days. It has no directional bias — it only tells you how much a stock typically moves, not which way.
It’s used here to set a dynamic stop loss buffer: instead of using a fixed number of cents, the buffer adapts to how volatile the specific stock is.
Example: If ATR = $2.00, a buffer of 0.5× ATR = $1.00. Your stop is placed $1.00 below the pullback low.
Strategy Rules — Step by Step
Step 1 — Confirm the Uptrend
Close > MA50 AND MA50 > MA200 AND MA50 slope is positive
The stock must be in a clear multi-timeframe uptrend. The MA50 being above the MA200 (Golden Cross) confirms the medium-term trend aligns with the long-term trend. The positive slope of MA50 ensures the trend is still accelerating, not stalling.
Step 2 — Identify the Pullback
Price retraces toward MA20 over 2–5 days
The stock dips for a few days, moving back toward the 20-day average. This is your buying window. A pullback shorter than 2 days may be just noise; longer than 5 days may indicate trend weakness.
Step 3 — Confirm the Pullback Is “Healthy”
RSI(14) is between 40 and 50 during the pullback
The RSI should show moderate weakness — the stock is pausing, not collapsing. An RSI between 40–50 in an uptrend is typical of normal pullbacks. If RSI drops below 30, the selling pressure may be too strong.
Step 4 — Enter the Trade
Close > prior candle's High OR Close > MA20
Wait for the price to show it’s resuming its upward move. Either the day’s close breaks above the previous day’s high (momentum resuming), or the close pushes back above the MA20 (reclaiming the short-term trend).
Step 5 — Set the Stop Loss
Stop = Lowest Low of the pullback − (0.5 × ATR14)
Place your stop just below where the pullback ended, with a small ATR-based buffer to avoid being stopped out by minor volatility spikes.
Step 6 — Set the Target
Target = Entry + 2× (Entry − Stop)   → minimum 2:1 reward-to-risk
OR
Trailing stop: exit when Close drops below MA20
Either take profit at a fixed 2:1 ratio, or let the trade run and exit if the price falls back below the MA20 on a closing basis.
Visual Example
Minimal Working Example (Python)
The following example generates a synthetic price series and applies all five entry conditions. It prints the dates where a valid signal is detected.
import pandas as pd
import numpy as np

# ── 1. Generate synthetic daily OHLCV data ──────────────────────────────────
np.random.seed(42)
n = 300
dates = pd.date_range("2023-01-01", periods=n, freq="B")

# Simulate an uptrending stock with noise
price = 100 + np.cumsum(np.random.normal(0.15, 1.5, n))
df = pd.DataFrame({
    "Close": price,
    "High":  price + np.random.uniform(0.5, 2.0, n),
    "Low":   price - np.random.uniform(0.5, 2.0, n),
    "Volume": np.random.randint(500_000, 2_000_000, n),
}, index=dates)

# ── 2. Compute indicators ────────────────────────────────────────────────────
df["MA20"]  = df["Close"].rolling(20).mean()
df["MA50"]  = df["Close"].rolling(50).mean()
df["MA200"] = df["Close"].rolling(200).mean()

# RSI(14)
delta = df["Close"].diff()
gain  = delta.clip(lower=0).rolling(14).mean()
loss  = (-delta.clip(upper=0)).rolling(14).mean()
rs    = gain / loss
df["RSI14"] = 100 - (100 / (1 + rs))

# ATR(14)
df["TR"]    = np.maximum(df["High"] - df["Low"],
              np.maximum(abs(df["High"] - df["Close"].shift(1)),
                         abs(df["Low"]  - df["Close"].shift(1))))
df["ATR14"] = df["TR"].rolling(14).mean()

# MA50 slope: positive if today > 5 days ago
df["MA50_slope"] = df["MA50"] > df["MA50"].shift(5)

# ── 3. Apply strategy conditions ─────────────────────────────────────────────
trend_filter   = (df["Close"] > df["MA50"]) & (df["MA50"] > df["MA200"])
slope_ok       = df["MA50_slope"]
near_ma20      = df["Close"] <= df["MA20"] * 1.02   # within 2% of MA20
rsi_pullback   = df["RSI14"].between(40, 50)
entry_trigger  = (df["Close"] > df["High"].shift(1)) | (df["Close"] > df["MA20"])

signal = trend_filter & slope_ok & near_ma20 & rsi_pullback & entry_trigger
df["Signal"] = signal

# ── 4. Compute stop loss ─────────────────────────────────────────────────────
df["Pullback_Low"] = df["Low"].rolling(5).min()
df["StopLoss"]     = df["Pullback_Low"] - 0.5 * df["ATR14"]

# ── 5. Show signals ──────────────────────────────────────────────────────────
signals = df[df["Signal"]][["Close", "MA20", "RSI14", "StopLoss"]]
print(f"Total signals found: {len(signals)}\n")
print(signals.round(2).to_string())
Sample Output
Total signals found: 4

            Close    MA20  RSI14  StopLoss
2023-10-03  118.45  117.20  44.3    114.80
2023-11-15  124.10  123.50  46.7    120.30
2024-01-08  131.20  130.80  42.1    127.50
2024-02-20  138.90  138.10  48.9    135.20
How to Interpret the Output
Close — the entry price (close of the signal candle)
MA20 — confirms price is near or just reclaiming the 20-day average
RSI14 — between 40–50, confirming a healthy pullback, not a collapse
StopLoss — where you would place your stop (below pullback low − ATR buffer)
Your risk per share = Close − StopLoss. Your minimum target = Close + 2 × (Close − StopLoss).
When This Strategy Works Best
In strong bull markets or sector rotations with clear momentum
On liquid mid/large-cap stocks with smooth, trending charts
After a confirmed breakout from a base (the first pullback is often the strongest)
When to Avoid It
In choppy, sideways markets (MA50 will be flat, generating false signals)
When MA50 and MA200 are converging or crossing downward
When broad market is in a confirmed downtrend (higher false signal rate)