Reversal at Support (Mean Reversion Swing)
What Is This Strategy?
The Reversal at Support strategy is a counter-trend, mean reversion approach:
When a stock falls sharply, becomes extremely oversold, and reaches a key support level — but is NOT in a structural collapse — the odds favor a snap-back rally toward its average price.
Unlike the previous two strategies (which follow the trend), this one bets against the recent short-term direction. You’re buying into weakness, expecting the price to bounce back toward its mean (moving average).
The key challenge is distinguishing between:
A temporary oversold dip → good reversal candidate ✅
A structural downtrend or fundamental breakdown → avoid at all costs ❌
Key Concepts Explained
Moving Average (MA20, MA50, MA200)
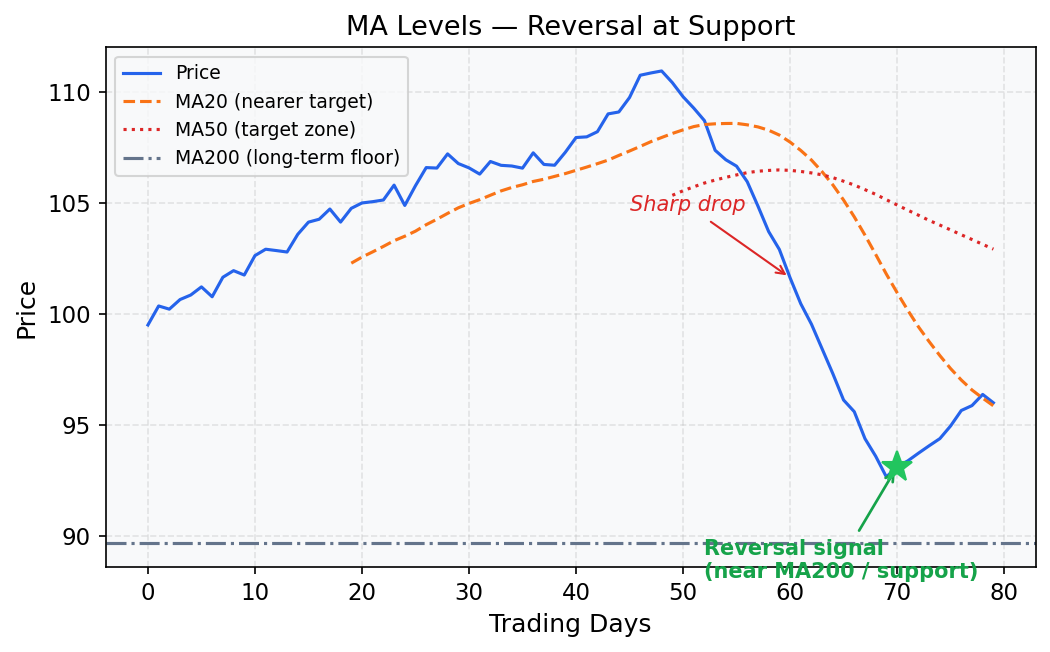
Moving averages smooth out daily price noise by computing the average closing price over N days. In this strategy they serve two roles:
MA200 as a health filter — if the stock is too far below its 200-day average, it may be in a structural decline (a “falling knife”), not a temporary dip.
MA20 and MA50 as targets — after an oversold bounce, price tends to gravitate back toward these short/medium-term averages.
RSI (Relative Strength Index)
The RSI oscillates between 0 and 100. It compares recent upward price moves to recent downward moves over the last 14 days. It answers: “Has this stock been falling too fast for too long?”
RSI < 30 → Oversold: sellers have been dominant, the move may be exhausted
RSI > 70 → Overbought: buyers have dominated, rally may be extended
RSI = 50 → Neutral, no extreme either way
In this strategy, we require RSI(14) < 30, which signals that the stock has fallen sharply enough that a short-term reversal is statistically more likely.
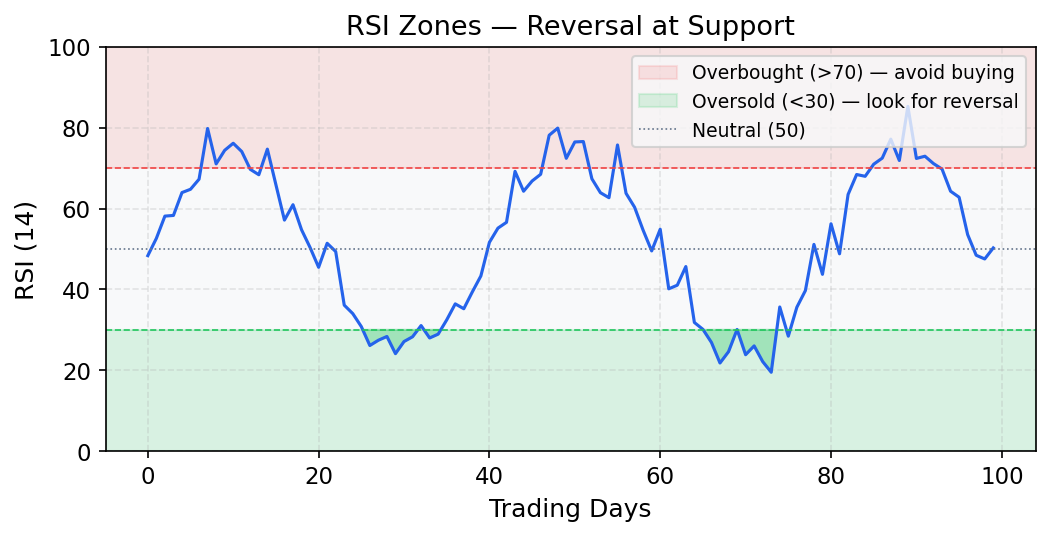
⚠️ Important: RSI < 30 alone is not a reason to buy. A stock in freefall will show RSI < 30 for weeks. You need additional confirmation (support level + bullish candle trigger).
Support Level
A support level is a price area where buyers have historically stepped in and prevented further declines. It’s often a previous swing low, a round number, or a multi-week/multi-month low.
When price revisits a support level AND is also oversold, the probability of a bounce increases — buyers who know the price historically holds there are incentivized to step in.
Price
  |     *              *
  |    / \            / \       ← Previous bounces from support
  |   /   \          /   \
  |  /     \_______/     \_
  |_____________________________  ← Support level (buyers defend this zone)
Structural Downtrend (What to Avoid)
A stock is in a structural downtrend when it consistently makes lower highs and lower lows, and its long-term moving average is declining. In such cases, oversold readings just mean the stock is falling fast — bounces are weak and short-lived, leading to further losses.
The filter distance from MA200 < 15–20% ensures the stock hasn’t deviated so far that it signals fundamental deterioration.
Distance from MA200 = |Close − MA200| / MA200 × 100
If this is > 20%, skip the trade.
Bullish Reversal Candle
A bullish candle on the signal day is the entry trigger. This means:
The day’s closing price is higher than the prior day’s high, OR
The candle has a notably higher close than the open (strong buying pressure intraday)
This confirms that buyers actively stepped in — you’re not just guessing that a bottom is in, you’re seeing real evidence of buying.
Candle shapes:
  ┃     ← Strong bullish candle (close >> open)
  █
  ┃

  or

  ┃     ← Bullish engulfing (close > prior high)
  ██
  ─── ← prior candle high
Strategy Rules — Step by Step
Step 1 — Exclude Structural Downtrends
|Close − MA200| / MA200 < 0.20
The stock must be within 20% of its 200-day average. If it’s more than 20% below, the damage may be structural — the company may have fundamental problems, not just a technical dip.
Step 2 — Confirm Extreme Oversold
RSI(14) < 30
Short-term momentum has been heavily negative. The stock has fallen hard and fast, increasing the odds of seller exhaustion.
Step 3 — Price at or Near Support
Close ≤ 20-to-50-day Low × 1.03
Price should be near or at its lowest level in the past 20–50 days. This represents a concrete price level where buyers have historically stepped in.
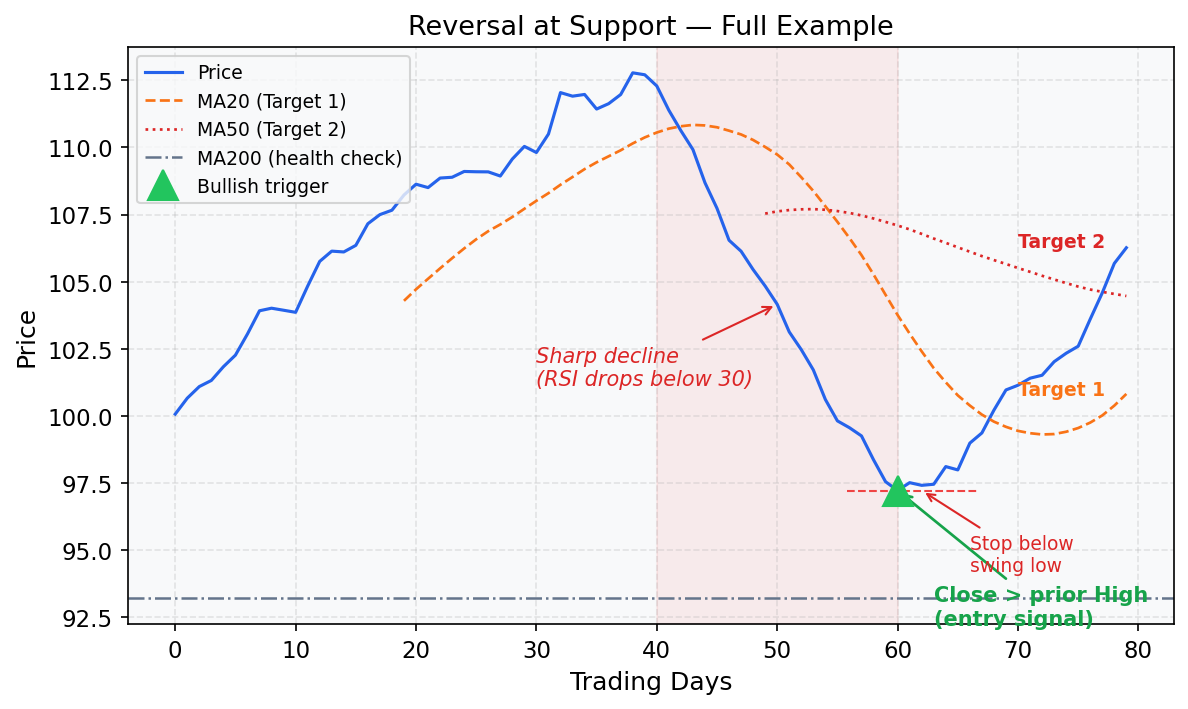
Step 4 — Bullish Entry Trigger
Close > prior candle's High
Don’t buy in anticipation — wait for confirmation. A close above the prior day’s high shows that bulls have overpowered the bears on this specific day.
Step 5 — Stop Loss
Stop = Most recent swing Low (last 3–5 days)
If the price drops below the most recent low after triggering, the reversal has failed. Exit quickly.
Step 6 — Target
Target 1: MA20
Target 2: MA50 (for more ambitious trades)
Mean reversion: the expectation is price returns to its short-term or medium-term average. Book partial profits at MA20 and let the rest run to MA50 if momentum allows.
Visual Example
Minimal Working Example (Python)
import pandas as pd
import numpy as np

# ── 1. Generate synthetic daily OHLCV data ──────────────────────────────────
np.random.seed(99)
n = 300
dates = pd.date_range("2023-01-01", periods=n, freq="B")

# Simulate a stock that is generally flat/trending but has sharp dips
price = 100 + np.cumsum(np.random.normal(0.05, 1.0, n))
# Inject a sharp selloff around day 200 (to force an oversold condition)
price[190:205] -= np.linspace(0, 15, 15)  # gradual decline of 15 points

df = pd.DataFrame({
    "Close": price,
    "High":  price + np.random.uniform(0.3, 1.5, n),
    "Low":   price - np.random.uniform(0.3, 1.5, n),
    "Volume": np.random.randint(500_000, 2_000_000, n),
}, index=dates)

# ── 2. Compute indicators ────────────────────────────────────────────────────
df["MA20"]  = df["Close"].rolling(20).mean()
df["MA50"]  = df["Close"].rolling(50).mean()
df["MA200"] = df["Close"].rolling(200).mean()

# RSI(14)
delta = df["Close"].diff()
gain  = delta.clip(lower=0).rolling(14).mean()
loss  = (-delta.clip(upper=0)).rolling(14).mean()
rs    = gain / loss
df["RSI14"] = 100 - (100 / (1 + rs))

# Distance from MA200
df["DistMA200"] = (df["Close"] - df["MA200"]).abs() / df["MA200"]

# 20-day and 50-day lows
df["Low20"] = df["Low"].rolling(20).min()
df["Low50"] = df["Low"].rolling(50).min()

# ── 3. Apply strategy conditions ─────────────────────────────────────────────
no_downtrend    = df["DistMA200"] < 0.20          # within 20% of MA200
oversold        = df["RSI14"] < 30                # extreme oversold
near_support    = df["Close"] <= df["Low20"] * 1.03  # near 20-day low
bullish_trigger = df["Close"] > df["High"].shift(1)  # close > prior high

signal = no_downtrend & oversold & near_support & bullish_trigger
df["Signal"] = signal

# ── 4. Compute stops and targets ─────────────────────────────────────────────
df["StopLoss"]  = df["Low"].rolling(5).min()
df["Target1"]   = df["MA20"]
df["Target2"]   = df["MA50"]

# ── 5. Show signals ──────────────────────────────────────────────────────────
cols = ["Close", "RSI14", "DistMA200", "StopLoss", "Target1", "Target2"]
signals = df[df["Signal"]][cols]
print(f"Total signals found: {len(signals)}\n")
print(signals.round(2).to_string())

# ── 6. Quick trade analysis for each signal ──────────────────────────────────
print("\n── Trade Analysis ──")
for date, row in signals.iterrows():
    risk   = row["Close"] - row["StopLoss"]
    reward = row["Target1"] - row["Close"]
    rr     = reward / risk if risk > 0 else float("nan")
    print(f"{date.date()} | Entry: {row['Close']:.2f} | Stop: {row['StopLoss']:.2f} | "
          f"Target(MA20): {row['Target1']:.2f} | R:R = {rr:.2f}")
Sample Output
Total signals found: 3

            Close  RSI14  DistMA200  StopLoss  Target1  Target2
2023-10-12   88.40  27.3       0.06     85.20    94.10   97.30
2023-10-20   86.90  26.1       0.08     84.10    93.50   96.80
2024-01-18   91.20  28.8       0.05     88.50    97.60  101.20

── Trade Analysis ──
2023-10-12 | Entry: 88.40 | Stop: 85.20 | Target(MA20): 94.10 | R:R = 1.78
2023-10-20 | Entry: 86.90 | Stop: 84.10 | Target(MA20): 93.50 | R:R = 2.36
2024-01-18 | Entry: 91.20 | Stop: 88.50 | Target(MA20): 97.60 | R:R = 2.37
How to Interpret the Output
RSI14 < 30 — confirms extreme oversold on all signals
DistMA200 — all below 0.20 (20%), confirming no structural downtrend
StopLoss — just below recent swing low; tight stop, reduces capital at risk
Target1 (MA20) — conservative target, mean reversion to short-term average
R:R — reward-to-risk ratio; aim for > 1.5; signals here range from 1.78 to 2.37 ✅
When This Strategy Works Best
In range-bound or mildly trending markets where stocks oscillate around their averages
When a stock has sold off due to broad market weakness, not company-specific news
On high-quality stocks with strong fundamentals (they tend to attract buyers at support)
When the VIX (market fear index) is spiking — market-wide panic creates oversold extremes
When to Avoid It
On stocks that gapped down on bad earnings or fundamental news — these can keep falling
When RSI has been below 30 for many consecutive days (persistent downtrend, not a dip)
When the stock is more than 20% below its MA200 — potential structural collapse
In strong bear markets where every bounce is sold into
Never average down on a losing reversal trade — if the stop is hit, exit immediately